Case report
Print chromatogram & case report here.

Educational Reference
Coinherited HbH disease and HbS heterozygous
- Hemoglobin H disease usually results from compound heterozygosity for a+ and ao thalassemia with three of the four a globin genes being deleted ( − − / − a ).
- In the child or adult the diagnosis of hemoglobin H disease can be suspected from the hemoglobin concentration, red cell indices, reticulocyte count and blood film.
- When the genotype of hemoglobin H disease coexists with sickle cell trait the percentage of hemoglobin S is lower even than in sickle cell trait with homozygosity for a+ thalassemia
_____________________________________________________________________________________________________
HbH disease and HbS heterozygous
Variation data: alpha thalassemia ( − − / − a ) ; b6 (Glu ® Val)
Case commentary:
Chromatography: the chromatogram shows the following hemoglobin peaks, Bart’s + altered F, F (shaded), glycated A, altered A, Ao , A2 (shaded) and S. Note that hemoglobin S is only 20%. Usually no hemoglobin H is seen on HPLC or hemoglobin electrophoresis although occasional cells containing hemoglobin H inclusions may be demonstrated. Hemoglobin Bart’s is usually present.
Other methods:
CAM (cellulose acetate membrane)
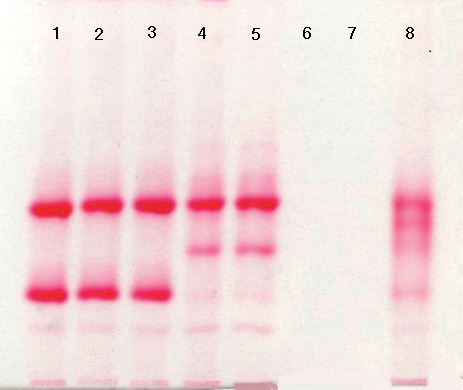
Hemoglobin electrophoresis on cellulose acetate at pH 8.5 from a patient with the genotype of hemoglobin H disease and coexisting heterozygosity for hemoglobin S (lanes 4 and 5) showing the following hemoglobins (from top down):
lanes 1 – 3, A + C;
lanes 4 and 5, faint Bart’s + A + S + faint A 2 ;
lanes 6 and 7, blank;
lane 8 control sample containing A + F + S + C.
Bands caused by carbonic anhydrase and the origin are obvious below C/A2 .
Hematology and Clinical Presentation:
There is a microcytic, hemolytic anemia with usually marked poikilocytosis.
FBC data: RBC 5.18 × 10¹² /l, Hb 86 g/l, Hct 0.286 l/l, MCV 55 fl , MCH 16.6 pg and MCHC 300 g/l.
Other studies:
External links: http://onlinelibrary.wiley.com/doi/10.1002/9781444328318.index/summary
Case and Comments from: “Bain, B. J., Wild, B. J., Stephens, A. D. and Phelan, L. A. (2010) Variant Haemoglobins: A Guide to Identification, Wiley-Blackwell, Oxford, UK.”
References: “Bain, B. J., Wild, B. J., Stephens, A. D. and Phelan, L. A. (2010) Variant Haemoglobins: A Guide to Identification, Wiley-Blackwell, Oxford, UK.”
Disclaimer: The chromatogram and data in this case report are actual laboratory findings. Bio-Rad Laboratories, Inc. does not validate or confirm the sample data included in this database. All information contained herein is for informational use only and is not meant as a definitive identification of the hemoglobin genotype nor for diagnostic purposes. We welcome your comments at hemoglobins@bio-rad.com